Complete Schedule Coverage
PAHO/CIM
April 11, 2025
Source:vignettes/complete_schedule_en.Rmd
complete_schedule_en.RmdRationale
The purpose of this analysis is to evaluate whether the target population has been fully vaccinated according to the country’s defined immunization schedule for a specific location, cohort and age.
Imagine the Republic of “ImmunoNation.” In ImmunoNation, a complete immunization schedule for a child might include the following:
- At birth: 1 dose of the BCG vaccine (which protects against tuberculosis).
- During the first 11 months: 3 doses of a vaccine containing DTP (this combination vaccine protects against Diphtheria, Tetanus, and Pertussis).
- At 12 months: 1 dose of the MMR vaccine (which protects against Measles, Mumps, and Rubella).
- At some point in childhood: 1 dose of the yellow fever vaccine.
This is just an example of what a complete immunization schedule could look like in a country like ImmunoNation. Each country defines the vaccines and the number of doses needed to protect its population from different diseases.
To construct this indicator, it is essential to assess if each individual received all doses specified in the schedule.
Note
All functions used for complete schedule coverage analyses within PAHOabc begin with the
cs_prefix.
Glossary
Political Geographic Boundaries
Throughout this vignette, we will make reference to different levels of political geographic boundaries. These levels are defined by the country/territory and can have different names from country to country. PAHOabc is agnostic to these names and requires the user to recode their variable names to fit the PAHOabc structure.
Namely, PAHOabc can distinguish three administrative levels, which listed from top to bottom level are: ADM0, ADM1 and ADM2.
- ADM0: The country. This is the top-most administrative level.
- ADM1: The first geographic subdivision in the country. ADM0 contains several ADM1 subdivisions.
- ADM2: The second geographic subdivision in the country. Each ADM1 contains several ADM2 subdivisions.
Vaccine Names
Our example datasets use a specific naming convention for the vaccine doses. This might not match your own naming schemes, but it will not affect the usage of the package as long as you make sure to be consistent when naming vaccine doses.
For example, the vaccine names used in the PAHOabc package are:
| Abbreviation | Full Name |
|---|---|
| SRP1 | Measles, Rubella, and Mumps Vaccine (1st dose) |
| DTP1 | Diphtheria, Tetanus, and Pertussis Vaccine (1st dose) |
| DTP2 | Diphtheria, Tetanus, and Pertussis Vaccine (2nd dose) |
| DTP3 | Diphtheria, Tetanus, and Pertussis Vaccine (3rd dose) |
| BCG RN | Bacillus Calmette–Guérin Vaccine (at birth) |
| YFV1 | Yellow Fever Vaccine (1st dose) |
Usage
Install Package
The first step to run the complete schedule coverage analyses is to install the PAHOabc package available on GitHub.
devtools::install_github("IM-Data-PAHO/pahoabc")Load Data
The functions in this module require you to provide three datasets in a specific format.
- Your EIR.
- The vaccination schedule related to this EIR.
- A table with population denominators depending on the geographic
level of your analysis.
- This is optional for the
cs_coverage()function (but not shown in this vignette).
- This is optional for the
To make it easy for you to test out PAHOabc’s functionality and understand the structure we require for your datasets, we will now explore the example datasets provided by PAHOabc that are required by this module.
EIR
The pahoabc::pahoabc.EIR data frame provides a
simulated, nominal-level table representing individual vaccination
events from an Electronic Immunization Registry (EIR). Each row
corresponds to a single vaccination act for a person, including
information on their residence, where they were vaccinated (occurrence),
their date of birth, and the vaccine dose received.
pahoabc.EIR %>% head() %>% kable(caption = "Example Electronic Immunization Registry")| ID | date_birth | date_vax | ADM1_residence | ADM2_residence | ADM1_occurrence | ADM2_occurrence | dose |
|---|---|---|---|---|---|---|---|
| 191997 | 2023-08-08 | 2023-12-26 | ADM1_4 | ADM2_4_35 | ADM1_4 | ADM2_4_35 | DTP2 |
| 212189 | 2023-12-20 | 2023-12-26 | ADM1_5 | ADM2_5_61 | ADM1_5 | ADM2_5_61 | BCG RN |
| 118063 | 2022-09-15 | 2023-12-26 | ADM1_2 | ADM2_2_5 | ADM1_2 | ADM2_2_5 | DTP1 |
| 118063 | 2022-09-15 | 2023-12-26 | ADM1_2 | ADM2_2_5 | ADM1_2 | ADM2_2_5 | YFV1 |
| 130751 | 2022-10-27 | 2023-12-12 | ADM1_5 | ADM2_5_55 | ADM1_5 | ADM2_5_55 | YFV1 |
| 136532 | 2021-09-21 | 2023-12-26 | ADM1_3 | ADM2_3_12 | ADM1_3 | ADM2_3_12 | SRP1 |
-
ID: Unique person identification number. -
date_birth: Date of birth of person. -
date_vax: Date of vaccination event. - ADM1: Refers to the first geographic administrative level of the country.
- ADM2: Refers to the second geographic administrative level of the country.
- Residence: Refers to the place where the person lives.
- Occurrence: Refers to the place where the vaccination event
occurred.
-
dose: A combined variable representing the vaccine type and its corresponding dose number. For example, DTP1 refers to the first dose of a vaccine containing diphtheria, tetanus, and pertussis components.
Vaccination Schedule
The pahoabc::pahoabc.schedule dataset defines the
national immunization schedule, listing each vaccine dose and its
recommended age of administration (in days). It helps the package
determine whether an individual is up to date with their
vaccinations.
pahoabc.schedule %>% kable(caption = "Example Immunization Schedule")| dose | age_schedule | age_schedule_low | age_schedule_high |
|---|---|---|---|
| SRP1 | 365 | 360 | 420 |
| DTP1 | 60 | 54 | 90 |
| DTP2 | 120 | 116 | 150 |
| DTP3 | 180 | 176 | 210 |
| BCG RN | 0 | 0 | 28 |
| YFV1 | 365 | 360 | 420 |
-
dose: A combined variable representing the vaccine type and its corresponding dose number. For example, DTP1 refers to the first dose of a vaccine containing diphtheria, tetanus, and pertussis components. -
age_schedule: The recommended age of administration of the correspondingdosein days. -
age_schedule_low: The lower limit for the target age in days. -
age_schedule_high: The upper limit for the target age in days.
Note
The
dosenames must match exactly those in thedosecolumn of thepahoabc.EIRdataset.
Population Denominators
This module will require you to provide a table with population denominators. The geographic level of this table will be directly dependent on the geographic level of your analysis. For example, if you were to perform an analysis at ADM1 level, the required population denominator table must contain the following.
pahoabc.pop.ADM1 %>% head() %>% kable(caption = "Example Population at ADM1")| ADM1 | year | age | population |
|---|---|---|---|
| ADM1_1 | 2022 | 0 | 1718.189 |
| ADM1_1 | 2022 | 1 | 1808.964 |
| ADM1_1 | 2023 | 0 | 1703.145 |
| ADM1_1 | 2023 | 1 | 1792.443 |
| ADM1_2 | 2022 | 0 | 6575.261 |
| ADM1_2 | 2022 | 1 | 6922.644 |
Note that this table is in long format and contains the corresponding
population of children of a specific age
during a given year for a certain ADM1
level.
Complete Schedule Coverage Analysis
Expected Workflow
The cs_coverage(), cs_barplot() and
cs_upsetplot() functions provide a way of analyzing and
visualizing complete schedule coverage. Their relationships are shown in
Figure 1.

Example
Below is a simplified example of the calculation of complete schedule coverage for the first subnational administrative level, focusing on the birth cohort of the year 2022.
# compute coverage
coverage_df <- cs_coverage(
  data.EIR = pahoabc.EIR,
  data.schedule = pahoabc.schedule,
  geo_level = "ADM1",
  birth_cohorts = 2022 # this can be a vector of years
)

# show results in table
coverage_df %>%
kable(digits = 2, caption = "Complete schedule coverage by ADM1 level")| year | ADM1 | numerator | population | coverage |
|---|---|---|---|---|
| 2022 | ADM1_1 | 406 | 1733 | 23.43 |
| 2022 | ADM1_2 | 1145 | 12428 | 9.21 |
| 2022 | ADM1_3 | 6508 | 50238 | 12.95 |
| 2022 | ADM1_4 | 1355 | 6382 | 21.23 |
| 2022 | ADM1_5 | 735 | 3488 | 21.07 |
Bar plot
It is possible to display the previously obtained results in a bar
plot with cs_barplot().
# visualize output from cs_coverage()
coverage_plot <- cs_barplot(data = coverage_df)

# show
coverage_plot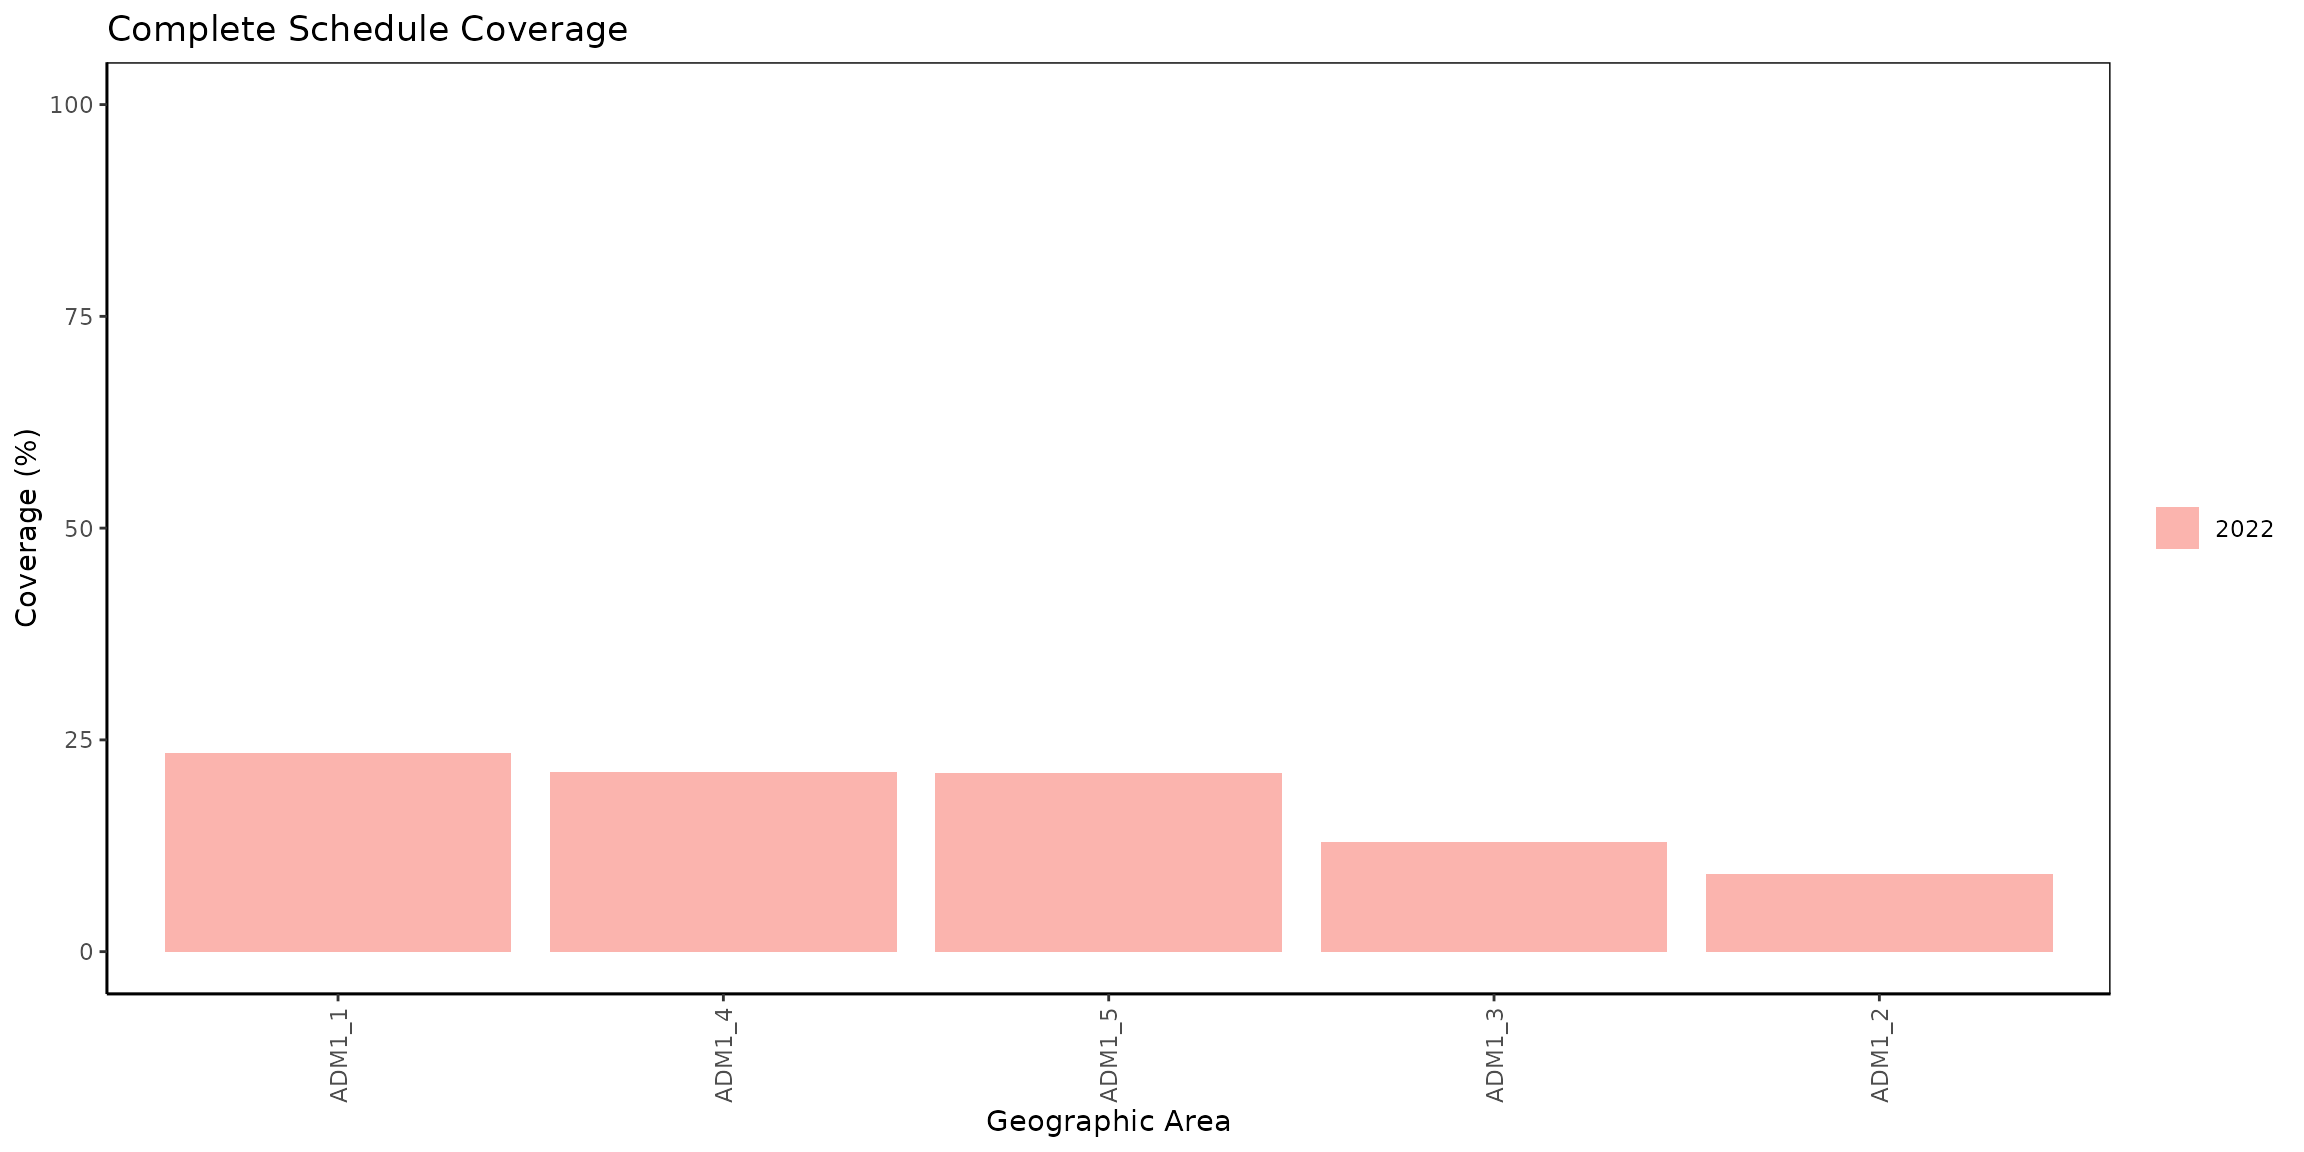
Upset plot
The cs_upsetplot() function allows us to produce an
upset plot to evaluate the percentage of individuals included in the EIR
who have received any of the possible combinations of the available
vaccines. The orange bar represents the proportion of individuals who
have received all the evaluated vaccines, thus indicating the complete
schedule coverage. The horizontal bars show the proportion of
individuals who received each specific vaccine (i.e., the coverage for
that vaccine).
# produce upset plot
coverage_upset <- cs_upsetplot(
  data.EIR = pahoabc.EIR,
  data.schedule = pahoabc.schedule,
  birth_cohort = 2022
)
## Warning: Using `size` aesthetic for lines was deprecated in ggplot2 3.4.0.
## ℹ Please use `linewidth` instead.
## ℹ The deprecated feature was likely used in the ComplexUpset package.
## Please report the issue at
## <https://github.com/krassowski/complex-upset/issues>.
## This warning is displayed once per session.
## Call `lifecycle::last_lifecycle_warnings()` to see where this warning was
## generated.
# show
coverage_upset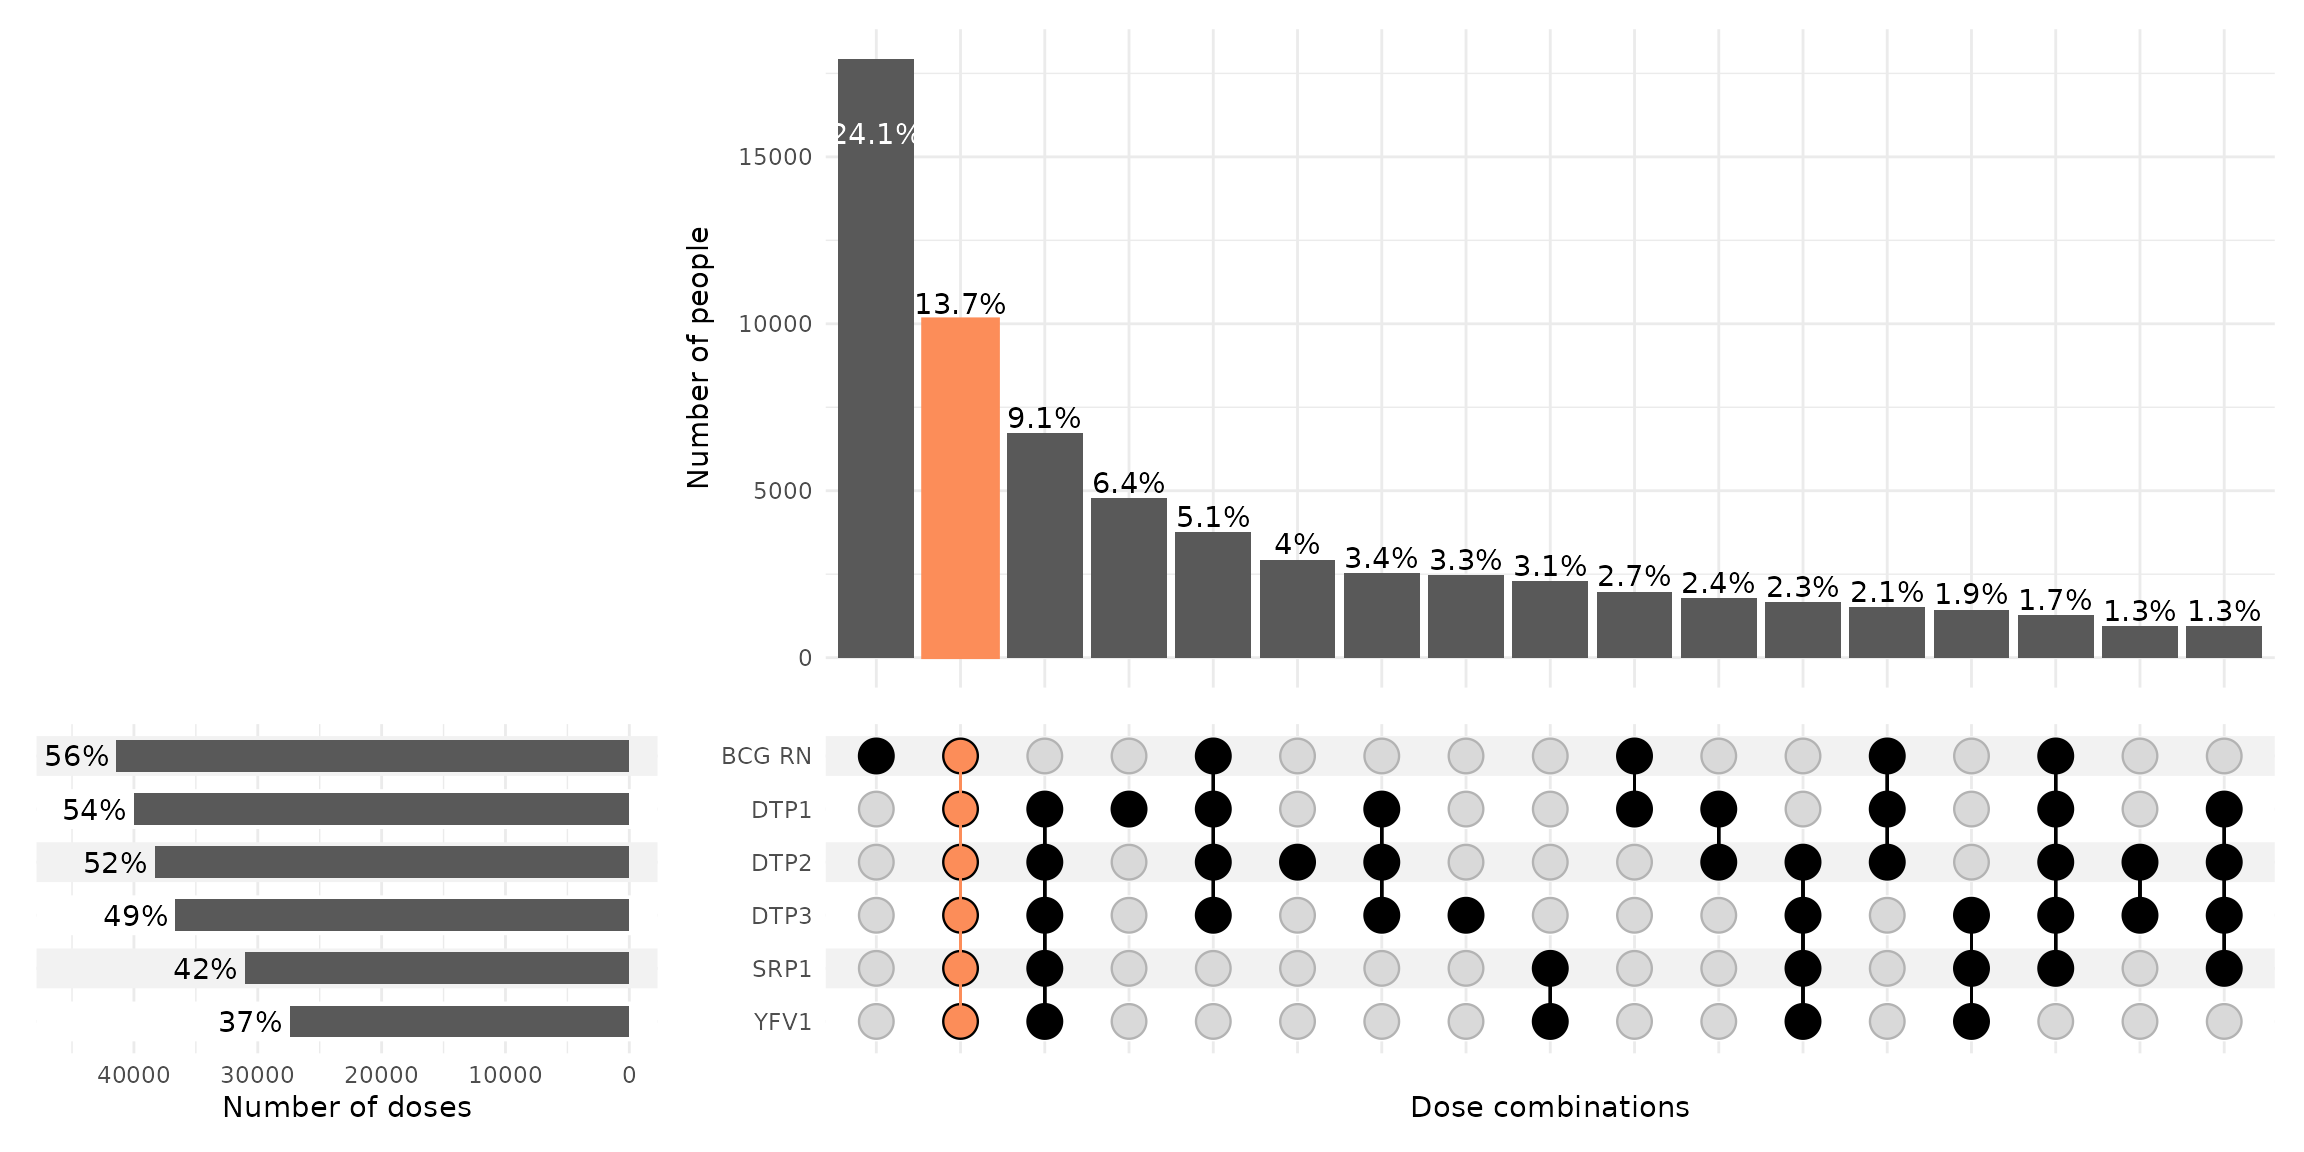
In the example the complete schedule coverage reached 13.7% and is represented by the orange bar.
It is noteworthy that 24.1% of individuals in the EIR received only the BCG vaccine, and that the third most frequent combination (9.1%) consists of individuals who received all other vaccines except BCG. This could indicate an error in recording a newborn’s BCG vaccine using temporary identification numbers.